Dashboard
The Dashboard provides an intuitive display providing real time monitoring information.
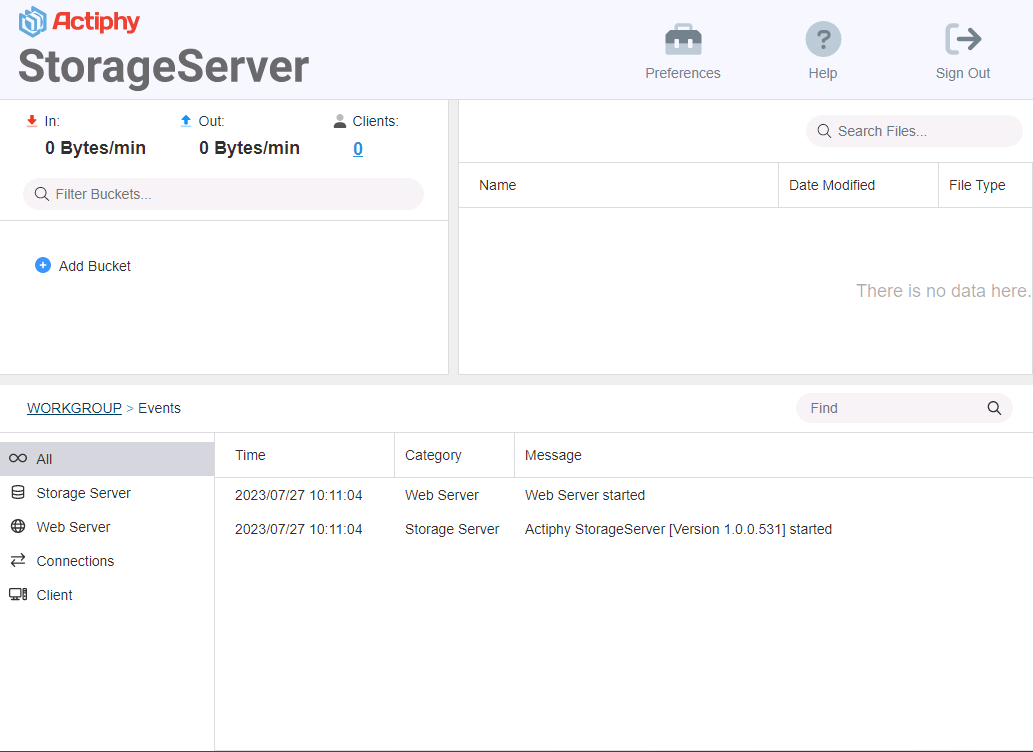
Network communication, Status
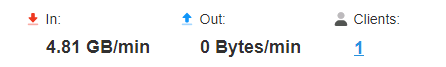
The current communication status (received and transmitted data volume) and the number of the connected clients is displayed.
By clicking on the received / transmitted data volume, you can select the display format [bits / sec] or [bps].
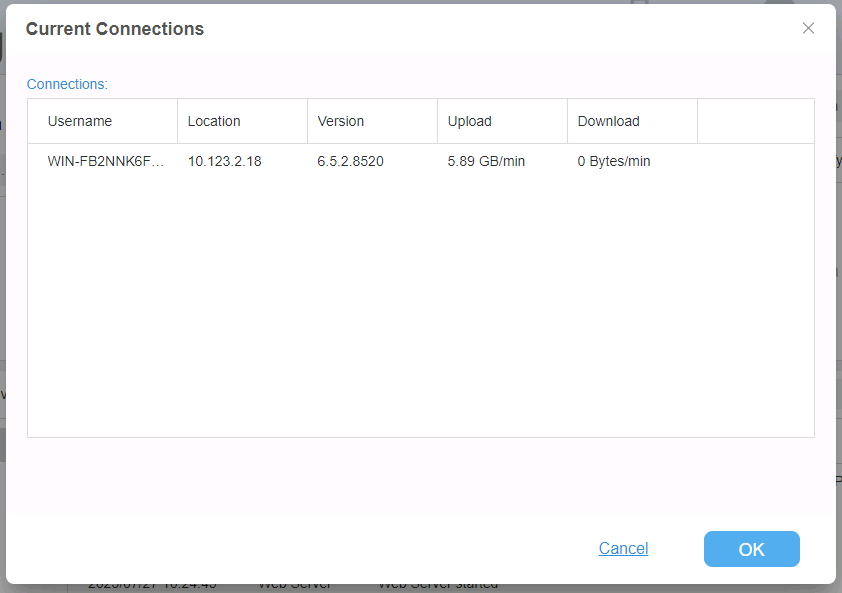
Click on the number of the connected clients. You can monitor the information for the respective connected clients.
The received / transmitted data volume from / to ActiveImage Protector and the received data volume from Actiphy StorageServer are displayed.
Bucket
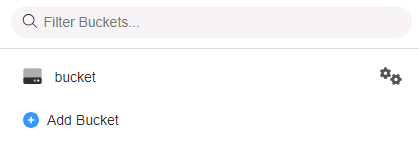
Currently configured buckets are listed.
Select a bucket in the list and the items in the bucket is displayed. Select an item and click on the trash can icon in [Operation] column to delete.
Please be aware that you cannot undo the action of deleting an item.
Create new bucket
Click [Add new bucket] to add a new bucket.
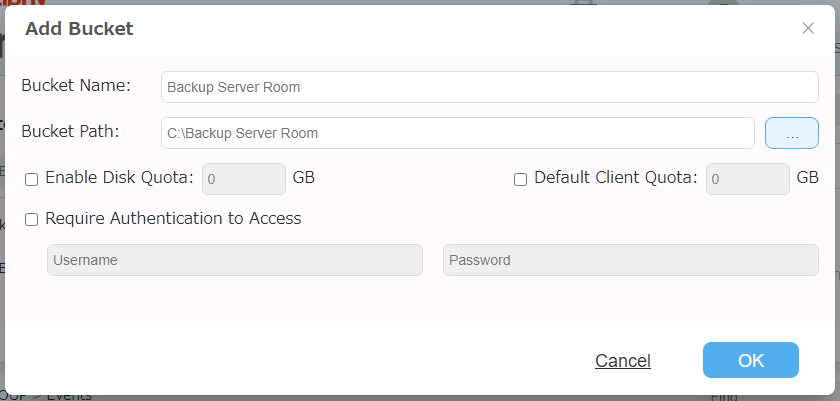
Please configure the following settings for the new bucket:
-
Bucket Name Bucket name is displayed when the connection from ActiveImage Protector client to StorageServer is established. A folder defined with this name is created in bucket path.
When a bucket is created without defining the bucket name, the new bucket is created under the name “Bucket_
"." -
Bucket path
Please specify the path of the location to configure the bucket.When the bucket is created without specifying the path, the bucket is configured in the path specified by selecting [Preference] - [Storage].
-
Disk quota Please specify the maximum limit of the disk space allocated to the bucket.
When the used disk space exceeds the limit while running the backup task for ActiveImage Protector client, the backup process continues.
When the backup task starts while the used disk space exceeds the limit, the backup task for ActiveImage Protector client fails in Error -800. -
Client quota
Please specify the maximum limit of the disk space allocated to the client.When the used disk space exceeds the limit while running the backup task for ActiveImage Protector client, the backup process continues.
When the backup task starts while the used disk space exceeds the limit, the backup task for ActiveImage Protector client fails in Error -802. {: .alert .alert-info } -
Authentication Setting
Enable [Request for authentication to access client] option to request for authentication before accessing a client.
Bucket Task
Click  button and the Bucket Task dialog will be displayed and you can configure the Replication setting to replicate the backup files to the bucket.
For more details, please refer here.
button and the Bucket Task dialog will be displayed and you can configure the Replication setting to replicate the backup files to the bucket.
For more details, please refer here.
Edit bucket settings
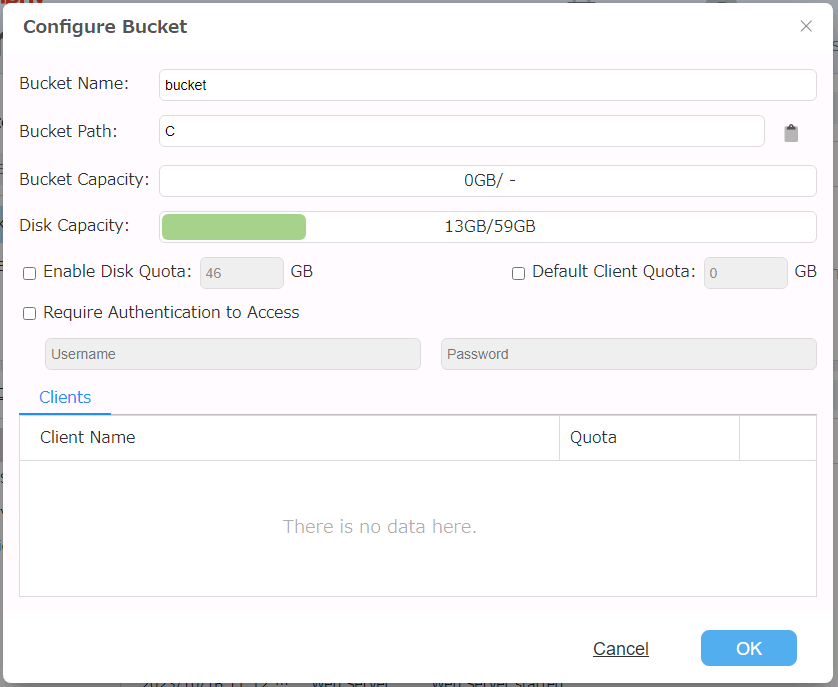
Click  button to display the bucket settings dialog as shown below.
-
Disk quota
Please specify the maximum limit of the disk space allocated to the bucket.When the used disk space exceeds the limit while running the backup task for ActiveImage Protector client, the backup process continues.
When the backup task starts while the used disk space exceeds the limit, the backup task for ActiveImage Protector client fails in Error -800. -
Client quota Please specify the maximum limit of the disk space allocated to the bucket.
When the used disk space exceeds the limit while running the backup task for ActiveImage Protector client, the backup process continues.
When the backup task starts while the used disk space exceeds the limit, the backup task for ActiveImage Protector client fails in Error -802.When you changed the default setting, the changed setting will be applied to the client registered after changing the setting. You can edit the setting for the existing registered clients respectively.
-
Authentication Setting
Enable [Request for authentication to access client] option to request for authentication before accessing a client.
Select the unwanted information of the bucket client and click on the trash can icon in [Operation] column to delete.
After deleting the folder of the client name from the bucket, you can delete it.
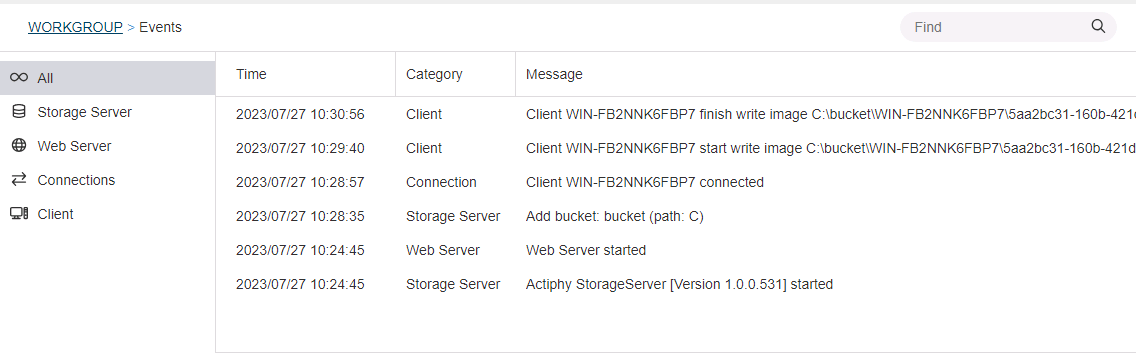
Event
The respective events are displayed.